Data Visualization
-
A deep dive into the ways data can be used to misinform the masses
9 min read -

An overly-enthusiastic application of science and data visualization to a question we’ve all been asking
22 min read -

Complete Tutorial to Automate 3D Data Visualization. Use Python to convert point clouds and 3D…
19 min read -

Bubble charts elegantly compress large amounts of information into a single visualization, with bubble size…
9 min read -

Introduction “Money can’t buy happiness.” “You can’t judge a book by its cover.” “An apple…
10 min read -
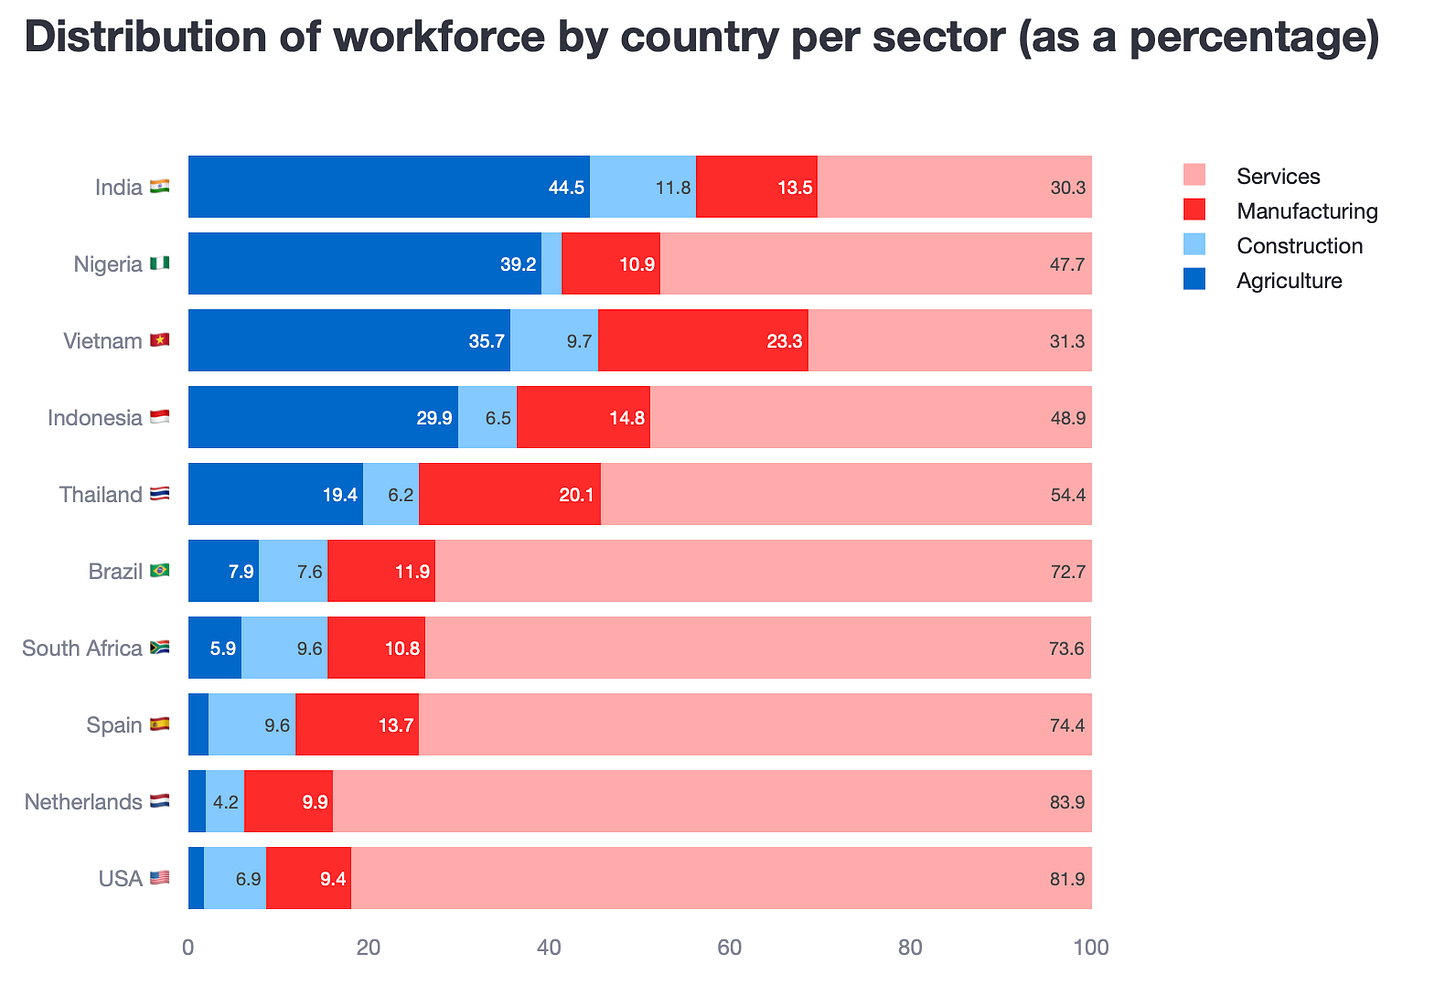
Simple methods to replace cluttered bar charts with crisp, reader-friendly visuals.
14 min read -

Plotting continuous real-time data with deque
7 min read -

Why descriptive statistics aren’t enough and plotting your data is always essential
10 min read -

Showcasing Soaring Wildfire Counts With Streamlit and Python: A Powerful Approach
Data VisualizationAnalyzing historical wildfire trends in Canada with public data
13 min read