
Authors: Chris Mauck, Jonas Mueller
Reliable model evaluation lies at the heart of MLops and LLMops, guiding crucial decisions like which model or prompt to deploy (and whether to deploy at all). In this article, we prompt the FLAN-T5 LLM from Google Research with various prompts in an effort to classify text as polite or impolite. Amongst the prompt candidates, we find the prompts that appear to perform best based on observed test accuracy are often actually worse than other prompt candidates. A closer review of the test data reveals this is due to unreliable annotations. In real-world applications, you may choose suboptimal prompts for your LLM (or make other suboptimal choices guided by model evaluation) unless you clean your test data to ensure it is reliable.

While the harms of noisy annotations are well-characterized in training data, this article demonstrates their often-overlooked consequences in test data.
I am currently a data scientist at Cleanlab and I’m excited to share the importance of (and how you can ensure) high-quality test data to ensure optimal LLM prompt selection.
Overview
You can download the data here.
This article studies a binary classification variant of the Stanford Politeness Dataset (used under CC BY license v4.0), which has text phrases labeled as polite or impolite. We evaluate models using a fixed test dataset containing 700 phrases.

It is standard practice to evaluate how "good" a classification model is by measuring the accuracy of its predictions against the given labels for examples the model did not see during training, usually referred to as "test", "evaluation", or "validation" data. This provides a numerical metric to gauge how good model A is against model B – if model A displays higher test accuracy, we estimate it to be the better model and would choose to deploy it over model B. Beyond model selection, the same decision-making framework can be applied to other choices like whether to use: hyperparameter-setting A or B, prompt A or B, feature-set A or B, etc.
A common problem in real-world test data is some examples have incorrect labels, whether due to human annotation error, data processing error, sensor noise, etc. In such cases, test accuracy becomes a less reliable indicator of the relative performance between model A and model B. Let’s use a very simple example to illustrate this. Imagine your test dataset has two examples of impolite text, but unknowingly to you, they are (mis)labeled as polite. For instance, in our Stanford Politeness dataset, we see an actual human annotator mistakenly labeled this text "Are you crazy down here?! What the heck is going on?" as polite when the language is clearly agitated. Now your job is to pick the best model to classify these examples. Model A says that both examples are impolite and model B says both examples are polite. Based on these (incorrect) labels, model A scores 0% while model B scores 100% – you pick model B to deploy! But wait, which model actually is stronger?
Although these implications are trivial and many are aware that real-world data is full of labeling errors, folks often focus only on noisy labels in their training data, forgetting to carefully curate their test data even though it guides crucial decisions. Using real data, this article illustrates the importance of high-quality test data to guide the choice of LLM prompts and demonstrates one way to easily improve data quality via algorithmic techniques.
Observed Test Accuracy vs Clean Test Accuracy
Here we consider two possible test sets constructed out of the same set of text examples which only differ in some (~30%) of the labels. Representing typical data you’d use to evaluate accuracy, one version has labels sourced from a single annotation (human rater) per example, and we report the accuracy of model predictions computed on this version as Observed Test Accuracy. A second cleaner version of this same test set has high-quality labels established via consensus amongst many agreeing annotations per example (derived from multiple human raters). We report accuracy measured on the cleaner version as Clean Test Accuracy. Thus, Clean Test Accuracy more closely reflects what you care about (actual model deployment performance), but the Observed Test Accuracy is all you get to observe in most applications – unless you first clean your test data!
Below are two test examples where the single human annotator mislabeled the example, but the group of many human annotators agreed on the correct label.

In real-world projects, you often don’t have access to such "clean" labels, so you can only measure Observed Test Accuracy. If you are making critical decisions such as which LLM or prompt to use based on this metric, be sure to first verify the labels are high-quality. Otherwise, we find you may make the wrong decisions, as observed below when selecting prompts for politeness classification.
Impact of Noisy Evaluation Data
As a predictive model to classify the politeness of text, it is natural to employ a pretrained Large Language Model (LLM). Here, we specifically use data scientists’ favorite LLM – the open-source FLAN-T5 model. To get this LLM to accurately predict the politeness of text, we must feed it just the right prompts. Prompt Engineering can be very sensitive, with small changes greatly affecting accuracy!
Prompts A and B shown below (highlighted text) are two different examples of chain-of-thought prompts, that can be appended in front of any text sample in order to get the LLM to classify its politeness. These prompts combine few-shot and instruction prompts (details later) that provide examples, the correct response, and a justification that encourages the LLM to explain its reasoning. The only difference between these two prompts is the highlighted text that is actually eliciting a response from the LLM. The few-shot examples and reasoning remain the same.

The natural way to decide which prompt is better is based on their Observed Test Accuracy. When used to prompt the FLAN-T5 LLM, we see below that the classifications produced by Prompt A have higher Observed Test Accuracy on the original test set than those from Prompt B. So obviously we should deploy our LLM with Prompt A, right? Not so fast!
When we assess the Clean Test Accuracy of each prompt, we find that Prompt B is actually much better than Prompt A (by 4.5 percentage points). Since Clean Test Accuracy more closely reflects the true performance we actually care about, we would’ve made the wrong decision if we just relied on the original test data without examining its label quality!

Is this just statistical fluctuation?
McNemar’s test is a recommended way to assess the statistical significance of reported differences in ML accuracy. When we apply this test to assess the 4.5% difference in Clean Test Accuracy between Prompt A vs. B over our 700 text examples, the difference is highly statistically significant (p-value = 0.007, X² = 7.086). Thus all evidence suggests Prompt B is a meaningfully better choice – we should not have failed to select it by carefully auditing our original test data!
Is this a fluke result that just happened to be the case for these two prompts?
Let’s look at other types of prompts as well to see if the results were just coincidental for our pair of chain-of-thought prompts.
Instruction Prompts
This type of prompt simply provides an instruction to the LLM on what it needs to do with the text example given. Consider the following pair of such prompts we might want to choose between.

Few-Shot Prompts
This type of prompt uses two instructions, a prefix, and a suffix, and also includes two (pre-selected) examples from the text corpus to provide clear demonstrations to the LLM of the desired input-output mapping. Consider the following pair of such prompts we might want to choose between.

Templatized Prompts
This type of prompt uses two instructions, an optional prefix, and a suffix, in addition to multiple-choice formatting so that the model performs classification as a multiple-choice answer rather than responding directly with a predicted class. Consider the following pair of such prompts we might want to choose between.

Results for various types of prompts
Beyond chain-of-thought, we also evaluated the classification performance of the same FLAN-T5 LLM with these three additional types of prompts. Plotting the Observed Test Accuracy vs. Clean Test Accuracy achieved with all of these prompts below, we see many pairs of prompts that suffer from the same aforementioned problem, where relying on Observed Test Accuracy leads to selecting the prompt that is actually worse.

Based on solely the Observed Test Accuracy, you would be inclined to select each of the "A" prompts over the "B" prompts amongst each type of prompt. However, the better prompt for each of the prompt types is actually prompt B (which has higher Clean Test Accuracy). Each of these prompt pairs highlights the need to verify test data quality, otherwise, you can make suboptimal decisions due to data issues like noisy annotations.
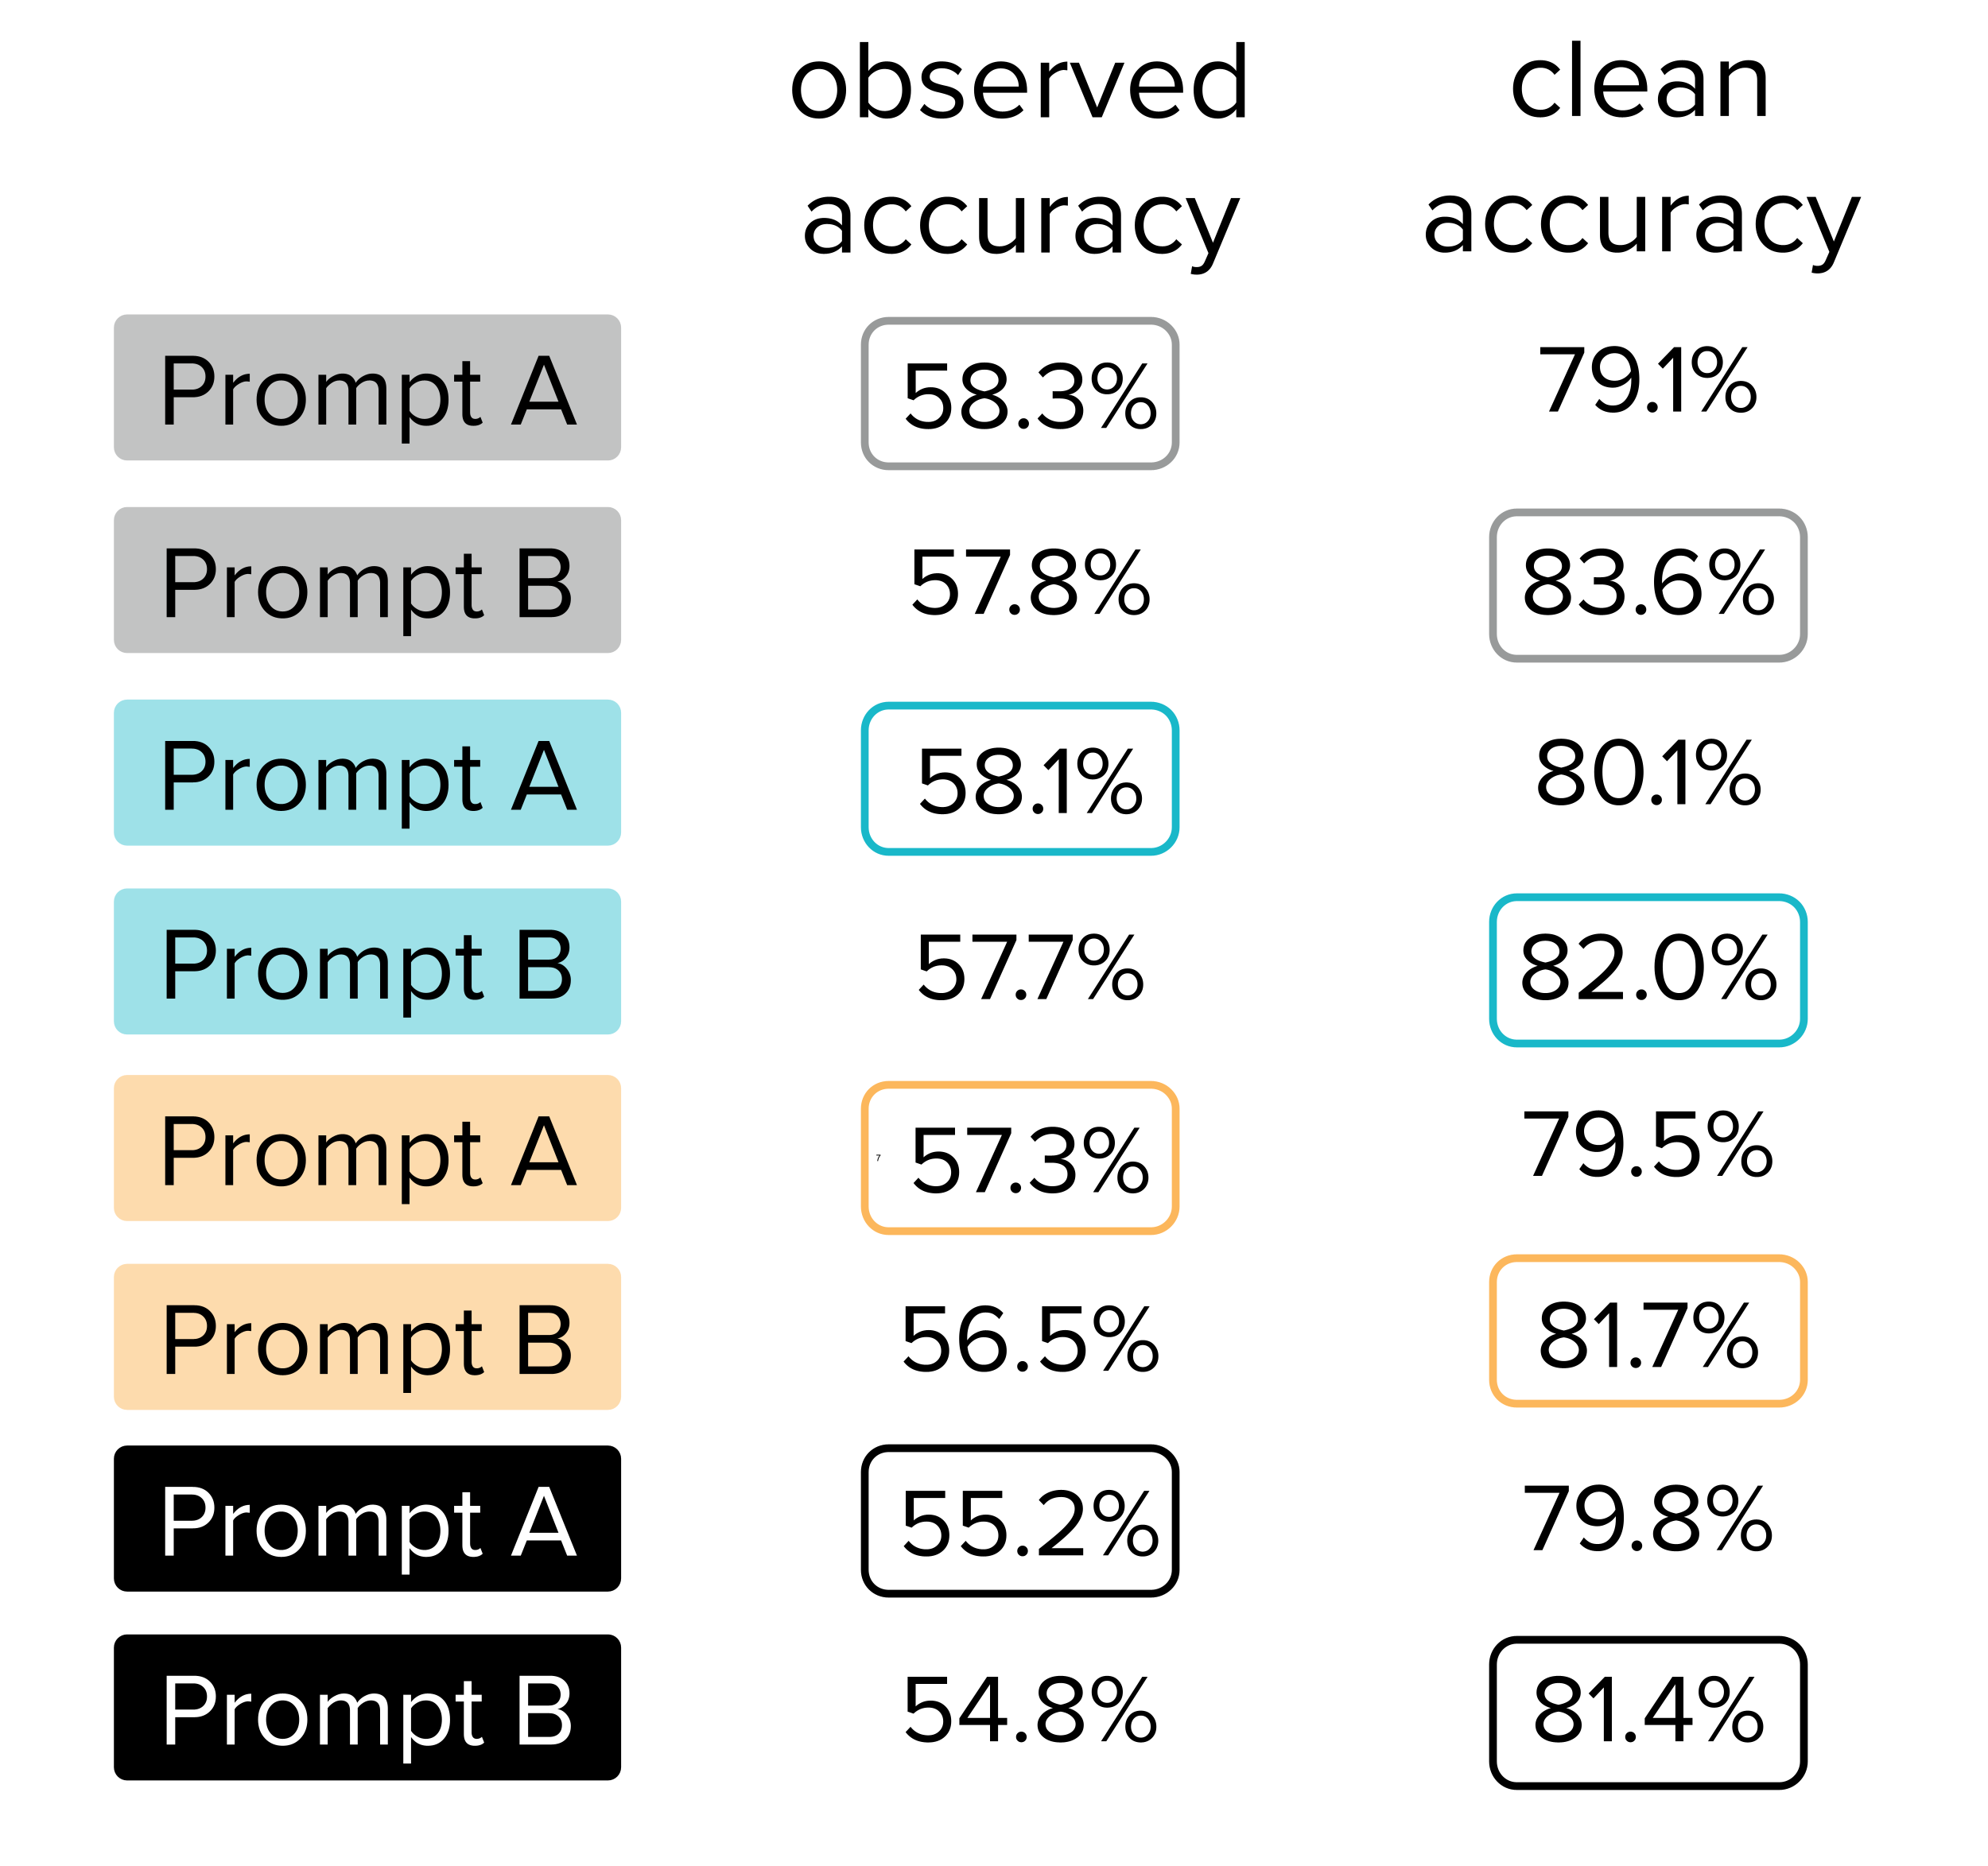
You can also see in this graphic how all of the A prompts observed accuracies are circled, meaning that they have higher accuracies than their B counterparts. Similarly, all of the B prompts clean accuracies are circled, meaning that they have higher accuracies than their B counterparts. Just like the simple example at the beginning of this article, you would be inclined to pick all of the A prompts, when in actuality the B prompts do a much better job.
Improving Available Test Data for More Reliable Evaluation
Hopefully, the importance of high-quality evaluation data is clear. Let’s look at a couple of ways you could go about fixing the available test data.
Manual Correction
The easiest way to ensure the quality of your test data is to simply review it by hand! Make sure to look through each of the examples to verify it is labeled correctly. Depending on the size of your test set, this may or may not be feasible. If your test set is relatively small (~100 examples) you could just look through them and make any corrections necessary. If your test set is large (1000+ examples), this would be too time-consuming and mentally to taxing to do by hand. Our test set is quite large, so we won’t be using this method!
Algorithmic Correction
Another way to assess your available (possibly noisy) test set is to use data-centric AI algorithms in order to diagnose issues that can be fixed to obtain a more reliable version of the same dataset (without having to collect many additional human annotations). Here we use Confident Learning algorithms (via the open-source cleanlab package) to check our test data, which automatically estimate which examples appear to be mislabeled. We then inspect only these auto-detected label issues and fix their labels as needed to produce a higher-quality version of our test dataset. We call model accuracy measurements made over this version of the test dataset, the CL Test Accuracy.

Using this new CL-corrected test set for model evaluation, we see that all of the B prompts from before now properly display higher accuracy than their A counterparts. This means we can trust our decisions made based on the CL-corrected test set to be more reliable than those made based on the noisy original test data.
Of course, Confident Learning cannot magically identify all errors in any dataset. How well this algorithm detects labeling errors will depend on having reasonable predictions from a baseline ML model and even then, certain types of systematically-introduced errors will remain undetectable (for instance if we swap the definition of two classes entirely). For the precise list of mathematical assumptions under which Confident Learning can be proven effective, refer to the original paper by Northcutt et al. For many real-world text/image/audio/tabular datasets, this algorithm appears to at least offer an effective way to focus limited data reviewing resources on the most suspicious examples lurking in a large dataset.
You don’t always need to spend the time/resources to curate a "perfect" evaluation set – using algorithms like Confident Learning to diagnose and correct possible issues in your available test set can provide high-quality data to ensure optimal prompt and model selections.
All images unless otherwise noted are by the author.


